

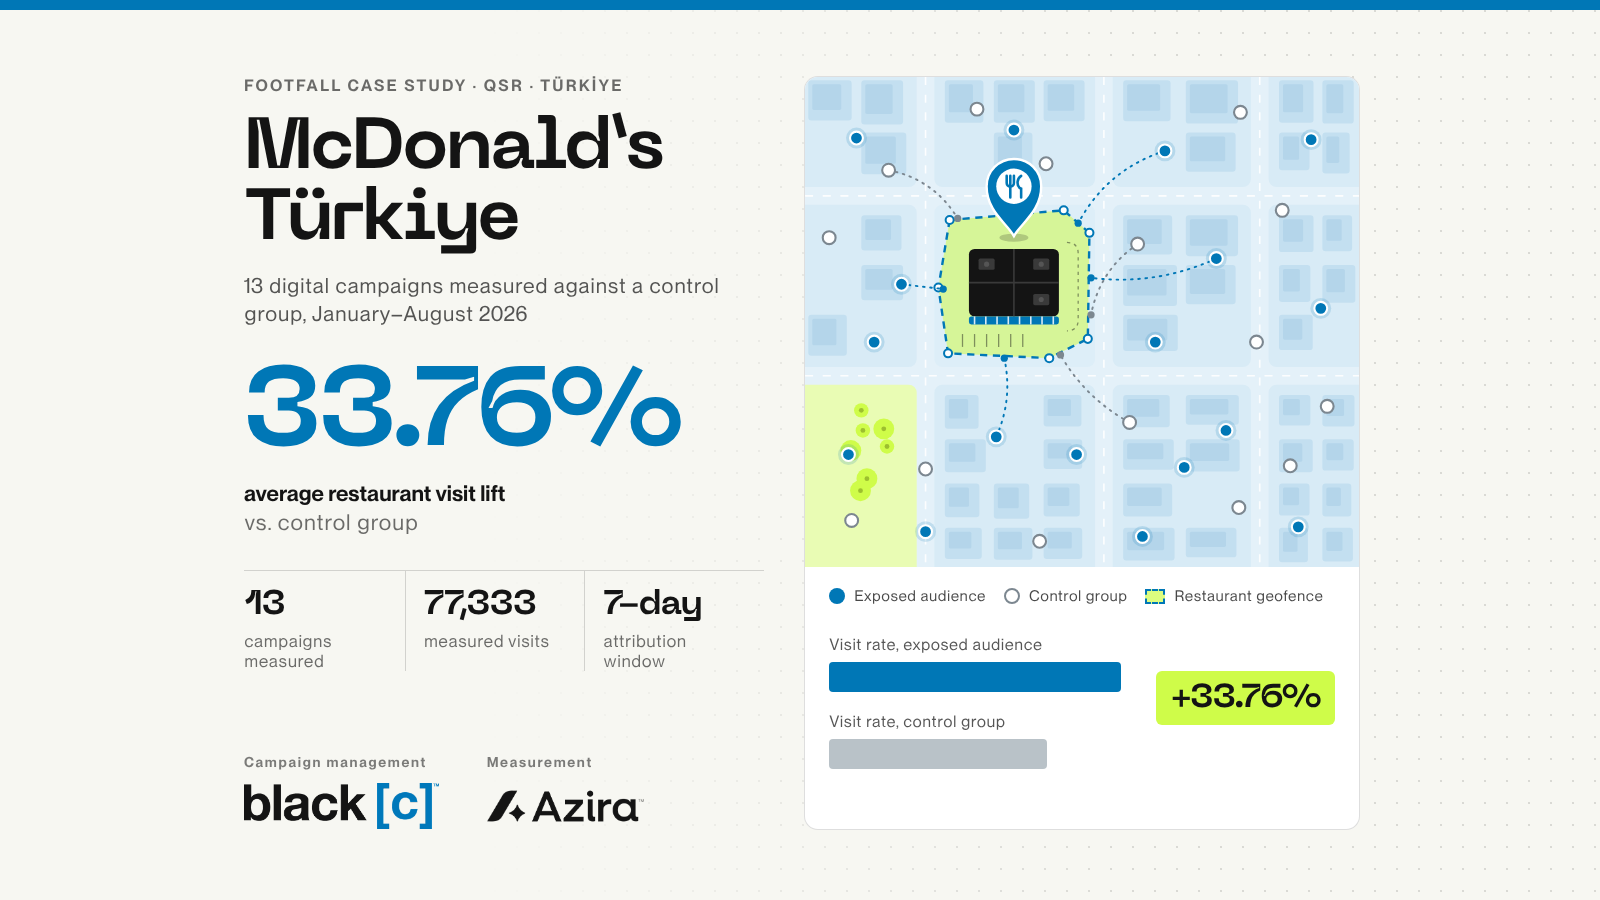

Across 13 digital campaigns run for McDonald’s Türkiye between January and August 2026, audiences exposed to the ads visited restaurants at a rate 33.76% higher on average than a control group. The measurement covers 77,333 visits and uses the same method in every campaign. Measurement: Azira, mobile location data. Campaign management: Black C Media.
Why measure restaurant visits instead of media metrics?
Impressions, reach and clicks show how a campaign performed as media. They do not show its effect on restaurant visits. In this study every campaign was measured with the same method, against a control group.
How was visit lift measured?
Visit lift is the percentage difference between the restaurant visit rate of the audience exposed to a campaign and the visit rate of a control group.
Each of the 13 campaigns was measured in three steps:
- Exposed audience. Campaign impressions are matched with mobile location data, and the devices exposed to the ads are deduplicated.
- Control group. An audience with a similar profile that was not exposed to the ads in the same period is built. This separates seasonality and effects unrelated to the campaign.
- Comparing visit rates. The restaurant visit rate of the two groups is calculated within a 7-day attribution window, and the difference is reported.
The measurement provider, the control group design and the attribution window are the same in all campaigns.
What did the measurement cover?
- Brand: McDonald’s Türkiye
- Category: QSR
- Period: January to August 2026
- Campaigns measured: 13
- Attribution window: 7 days
- Measurement: Azira, mobile location data
- Campaign management: Black C Media
How much did restaurant visits increase?
In all 13 measured campaigns, the audience exposed to the ads visited restaurants at a higher rate than the control group. The average visit lift is 33.76%, and results range from 27.18% to 44.73%.
11 of the 13 campaigns fall in the 30% to 39% band. This band can be used as a reference when evaluating new campaigns.
| Visit lift band | Campaigns |
|---|---|
| 27–30% | 1 |
| 30–33% | 6 |
| 33–36% | 3 |
| 36–39% | 2 |
| 39–42% | 0 |
| 42–45% | 1 |
Number of campaigns by visit lift band, 13 campaigns in total.
How soon after ad exposure do visits happen?
59% of visits take place in the first three days, and 26% on the day of exposure. The share is highest on the first day and declines gradually over the following days.
| Time between exposure and visit | Share of visits |
|---|---|
| Same day | 26.1% |
| Day 1 | 18.7% |
| Day 2 | 14.6% |
| Day 3 | 13.2% |
| Day 4 | 10.8% |
| Day 5 | 8.8% |
| Day 6 | 7.8% |
Visit-weighted average of 13 campaigns.
Visits are spread across the day; the busiest time slot is 10:00 to 14:00. Among people who were exposed to the ads and visited a restaurant, the share of women is higher in every campaign, between 51% and 64%.
What do the findings mean for campaign planning?
- Effect on visits. In all 13 measured campaigns, the visit rate of the exposed audience is above the control group. The average visit lift is 33.76%.
- Reference band. 11 of the 13 campaigns fall between 30% and 39%. This band can be used as a reference when evaluating new campaigns.
- Flight schedule. 59% of visits take place in the first three days after exposure. Flight schedules and budget allocation can be planned with this concentration in mind.
- Audience selectivity. Campaigns run with a narrow, selective audience recorded the highest visit rate and visit lift. Testing the approach in broader campaigns is recommended.
What are the limits of this measurement?
The study measures restaurant visits, not sales. The reported visits are those detected through mobile location data and do not represent the total traffic of the restaurants.
Key points
- 13 digital campaigns for McDonald’s Türkiye, measured between January and August 2026, show an average restaurant visit lift of 33.76% against a control group.
- Visit lift ranges from 27.18% to 44.73%, and 11 of the 13 campaigns fall between 30% and 39%.
- The measurement covers 77,333 restaurant visits detected through mobile location data.
- 59% of visits take place in the first three days after ad exposure, 26% on the same day.
- Every campaign was measured by Azira with the same control group design and a 7-day attribution window.